

Osama Kheshaifaty
Petroleum Engineer
Safaniya Reservoir Management Department
Introduction
Managing high water-cuts in mature oil reservoirs poses a significant challenge, affecting not only operational costs but also oil production efficiency and ultimately, a reservoir’s profitability. High water cut leads to increased costs for water handling, treatment, and disposal, resulting in lower net oil recovery and decreased profitability.
Within the broader context of a field’s water management strategy – a comprehensive framework aimed at optimizing hydrocarbon recovery while minimizing water-related costs and environmental impacts – various solutions are employed to tackle high water cut issues. These solutions, including sidetracking, water shutoff techniques, and well abandonment with re-drilling, serve as tactical implementations within the overarching water management strategy. This article focuses on economically evaluating these discrete solutions on a well-level, comparing their effectiveness and providing insights for informed decision-making in reservoir management.
The analysis employs a discounted cash flow model, incorporating key parameters such as production profiles, operating expenditures, and capital investments. Using Net Present Value (NPV) and Incremental NPV (ΔNPV) as primary metrics allows for a rigorous economic assessment of each solution’s economic merits.
The Importance of Assumptions in Economic Analysis
Assumptions are a key element of any economic analysis. They guide cash flow projections, present worth calculations, and inform risk assessments. However, overly optimistic or incorrect assumptions may lead to flawed analysis and decisions. Therefore, each assumption must be carefully justified to ensure that it reflects realistic scenarios based on data and expert judgment.
Given the specific context of this study, we assume that all operations take place in an offshore environment, characterized by unique logistical and cost structures distinct from land-based projects.
Key Assumptions:
1. Oil Price: A fixed price of $70 per barrel is assumed in the analysis.
2. Discount Rate: Reflects the time value of money and risk profile, fixed at 10% in this evaluation.
3. Production Forecast: Estimated oil and water production rates are based on synthetic figures for illustrative purposes. In practical applications, these forecasts should be derived from simulation models.
4. Success Rates: The analysis assumes a 100% success rate for each strategy. In reality, the expected NPV (ENPV) is often calculated by considering the probability of each scenario’s success, multiplied by its NPV.
5. Regulatory Costs: Compliance costs with environmental regulations and carbon intensity impacts are not included in this analysis but should be considered in real-world applications. Rough estimates suggest these costs could range from 5-15% of total operating expenses.
6. Time Horizon: The period over which the analysis is conducted (10 years in this evaluation).
7. Recovery Impact: In cases involving sidetracking or well abandonment, any potential reduction in recovery due to leaving bypassed oil is accounted for in Year 10 of the analysis as a long-term impact. This can be calculated by factoring in the volume of unrecovered oil and adjusting the price over time.
8. Operational Costs: Set at $15 per fluid barrel, plus $3 per barrel of water produced for handling. Additional costs from facility maintenance and other field services are not included.
9. Production Limit: The well is shut-in at an optimal water cut threshold determined by economic analysis, considering both revenue generation and expense minimization. In this analysis, it is assumed to be at 80% water cut.
10. Prices: Inflation and price escalation were neglected for simplicity.
11. Taxes and Royalties: Not applicable in this simplified analysis, but actual projects should factor in relevant taxation schemes and royalty payments.
These assumptions serve as the basis for the economic evaluation of each water management strategy. It is important to note that changes in any of these assumptions can significantly alter the analysis outcomes. Therefore, sensitivity analysis and scenario testing are employed to assess the robustness of the results against varying conditions.
Base Scenario (Do-Nothing Option)
In the base scenario (do-nothing option), it is assumed that the well continues to produce with an increasing water cut, leading to declining oil production and rising costs. The NPV of this scenario serves as the baseline against which other strategies are compared.
Scenario Specific Assumptions:
– Production: 2000 BPD gross fluid rate initially, with 10% annual decline
– Water Cut: 50% initially, increasing by 10% annually
– Cost Factors: No additional costs from facilities maintenance or other services; no impact on recovery
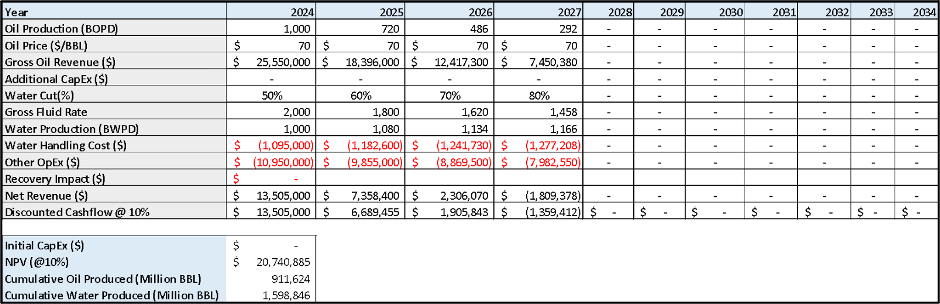
Figure 1: Economic Evaluation Sheet of Base Scenario
Summary: The base scenario provides a baseline NPV to which the other scenarios’ NPVs are compared, with cumulative oil production of 0.91 MMBBLs and cumulative water production of 1.6 million barrels.
Method 1: Sidetracking
Sidetracking involves drilling a new wellbore from the existing well to bypass water-encroached zones and access untapped hydrocarbon reservoirs. This method aims to boost oil production by accessing more productive areas of the reservoir.
Scenario Specific Assumptions:
– No production in year 1 due to operations
– Initial CapEx: $5,500,000
– Production: 4000 BPD gross fluid rate starting in Year 2, declining by 10% annually
– Water Cut: 0% initially, increasing by 5% annually in the first 3 years, and 10% annually afterward
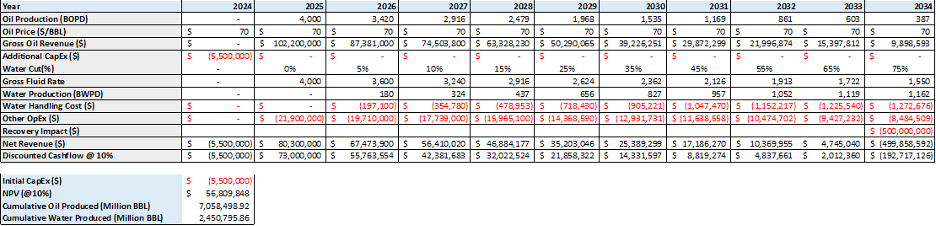
Figure 2: Economic Evaluation Sheet of Method 1
Summary: Sidetracking yields significant increase in NPV compared to the base scenario, with cumulative oil production of 7.1 MMBBLs and cumulative water production of 2.4 MMBBLs.
Method 2: Water Shutoff Techniques
Water shutoff techniques involve using mechanical or chemical methods to reduce water production from specific zones within the well. For instance, mechanical methods may include installing bridge plugs or packers to physically isolate high-water-producing zones, while chemical methods might employ polymers or gels to selectively block water flow in those areas. This method targets areas where water production is disproportionately high relative to oil.
Scenario Specific Assumptions:
– No production in year 1 due to operations
– Initial CapEx: $500,000
– Production: 2500 BPD gross fluid rate starting in Year 2, declining by 10% annually
– Water Cut: 10% initially, increasing by 15% annually
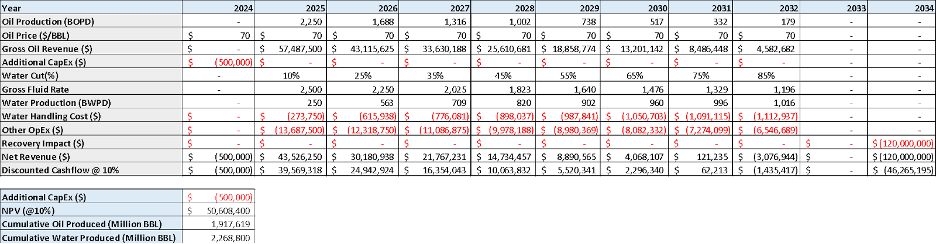
Figure 3: Economic Evaluation Sheet of Method 2
Method 3: Well Abandonment and Re-drilling
Well abandonment and re-drilling may be considered when other methods are not viable. This involves abandoning the existing well and drilling a new one in a different location or a different reservoir zone.
Assumptions:
– No production in year 1 due to operations
– Initial CapEx: $20,000,000 cost of abandonment and drilling new well
– Production: 4000 BPD gross fluid rate starting in Year 2, declining by 10% annually
– Water Cut: 0% initially, increasing by 5% annually first 3 years, and 10% annually after

Figure 4: Economic Evaluation Sheet of Method 3
Summary: Well abandonment and re-drilling result in a higher NPV compared to the base case, with cumulative oil production of 7.1 MMBBLs and cumulative water production of 2.5 MMBBLs. Note that there is a major recovery impact that quantifies the losses from remaining oil. This is a complex number to obtain, but can typically be estimated through simulation modelling.
Comparative Evaluation
Incremental NPV is used to evaluate the financial impact of one investment or project over another by comparing their NPVs. ΔNPV helps determine if the incremental benefits of one option justify the additional investment compared to another option.
To calculate Incremental Cash Flows:
Interpretation:
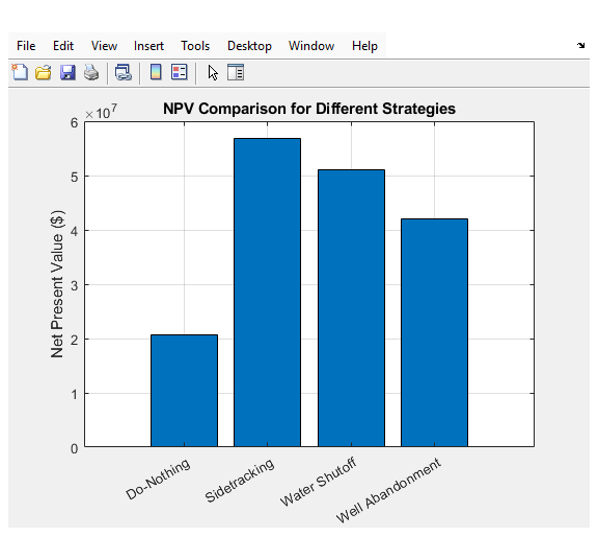
Figure 5: Bar chart of the NPV of each method
Sidetracking vs. Base Scenario:
ΔNPV = Discounted Sum of Sidetracking Cash Flows – Base Scenario Cash Flows
ΔNPV = $36.1 Million
The results indicate that the sidetracking option adds value compared to the base option where no action is taken, and is therefore financially favorable.
Comparing Water Shutoff vs. Sidetracking:
ΔNPV = Discounted Sum of Water Shutoff Cash Flows – Sidetracking Cash Flows
ΔNPV = -$6.2 Million
Negative value indicating that sidetracking is more financially favorable, but requires higher initial CapEx.
Comparing Well Abandonment & Re-drilling vs. Sidetracking:
ΔNPV = Discounted Sum of P&A and Re-drill Cash Flows Subtracted from Sidetracking Cash Flows
ΔNPV = -$14.5 Million
Negative value indicating that sidetracking is more financially favorable, and requires lower initial CapEx.
NPV Insight: For the one-well case presented, sidetracking provides the highest NPV, followed by water shutoff. It is important to note the magnitude of the ΔNPV, as smaller values indicate equivalent or close economic outcome. Other technical considerations are to be factored in for comprehensive decision making.
Strategy Alignment: A key consideration when selecting a water management strategy at the well level is ensuring alignment with the broader field development plan and depletion strategy. Any chosen solution – whether sidetracking, water shutoff, or another technique – must complement the overall goal of maximizing hydrocarbon sweep efficiency and ultimate recovery across the entire field. Therefore, it is crucial to consider how individual well interventions fit into the larger reservoir management framework, considering factors such as fluid movement, pressure maintenance, and injection/production patterns to optimize cumulative recovery and minimize stranded resources.
Additional considerations:
- Producing large amounts of water alongside oil can lead to environmental concerns, including increased energy consumption and greenhouse gas emissions. Evaluating the environmental footprint of each water management strategy is essential to minimizing harm and meeting sustainability goals.
- The initial capital expenditure (CapEx) required for each water management method varies significantly, with some options requiring substantial upfront investments.
- Understanding the success rate and reliability of each water management method is critical to mitigating risks and informing decisions. Historical performance data can help identify potential pitfalls and guide the selection of the most effective approach for a given field or asset.
Advanced Analytical Techniques
Incorporating Sensitivity Analysis
Sensitivity analysis helps identify the most influential factors affecting the economic outcomes of each water management strategy. For example, a sensitivity chart could show that the NPV for sidetracking is highly sensitive to oil price fluctuations, while the NPV for water shutoff is more influenced by intervention success rates.

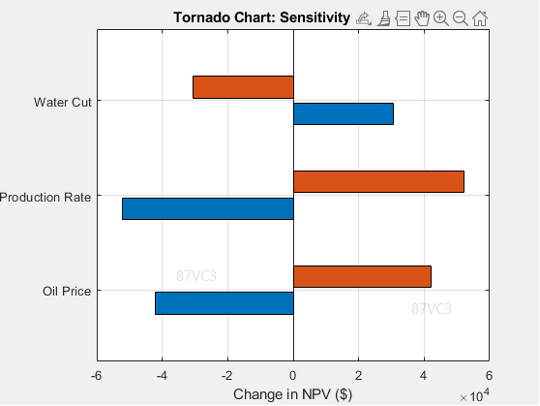
Figure 6: Examples of sensitivity analysis for evaluating price impact on each method’s NPV (left), and variability in production parameters’ impact on NPV (right)
Handling Uncertainty: Monte Carlo Simulation
Incorporating Monte Carlo simulation into cash flow models is essential for handling the uncertainty inherent in reservoir management. By simulating thousands of scenarios with different combinations of variables—such as oil prices, production rates, and water cut percentages—a probabilistic distribution of potential outcomes can be generated. This distribution provides valuable insights into the risk and reward profiles of each strategy, helping decision-makers to choose the option with the best balance of expected return and risk.
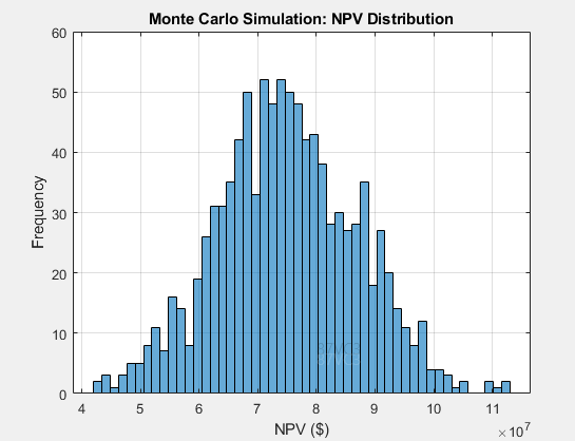
Figure 6: Monte Carlo Simulation results – Distribution of NPV values
Risk Quantification & Expected Value
In risk quantification, the concept of Expected Value (EV) is used to quantify the potential outcomes of a decision under uncertainty. EV is calculated by weighting each possible outcome by its probability and then summing these weighted values. This approach provides a single value that represents the average outcome if the scenario were repeated many times. For example, if there are multiple scenarios for oil prices, production rates, and water cut percentages, the expected NPV can be calculated by considering the probability of each scenario and summing the NPVs multiplied by their respective probabilities. This metric helps in making informed decisions by considering both the potential returns and the associated risks.
Environmental Impact & Regulatory Considerations
Environmental impact and regulatory compliance are crucial factors in the implementation of water management strategies in reservoir engineering. High cumulative water production can lead to significant environmental concerns, such as increased carbon intensity and greater energy consumption for water handling processes. Additionally, strict regulations on water disposal, emissions, and carbon footprint must be factored into the economic evaluation, as non-compliance can lead to fines and operational disruptions. Considering these environmental and regulatory impacts is essential for making informed decisions that are not only economically viable but also environmentally responsible, ensuring sustainable reservoir management.
Conclusion
In conclusion, this analysis highlights the importance of distinguishing between water management strategies and solutions. While solutions focus on addressing immediate well-level high water production, strategies encompass a broader perspective, aligning with long-term business objectives and organizational capabilities. Effective economic evaluation of water management solutions demands attention to detail, combining incremental net present value analysis with statistical tools like Monte Carlo simulations, sensitivity analyses, and expected value calculations. By incorporating this comprehensive method, reservoir engineers can craft robust frameworks for decision-making, guaranteeing that selected solutions reach an optimal balance between technical feasibility and economic viability. Ultimately, this strategic mindset fosters more resilient reservoir management practices and unlocks long-term value.